Plot a lineage definition matrix
plot_lineage_defs.RdPlot a lineage definition matrix
Usage
plot_lineage_defs(
  lineage_defs,
  col = colorRampPalette(colors = c("white", "dodgerblue4")),
  main = NULL
)
Arguments
- lineage_defs
Lineage definition matrix, such as those produced by
astronomize()andusher_barcodes().Alternatively the output ofprovoc(), from which the lineage definition matrix will be extracted.- col
A function that takes argument
nand returns a vector of colours of lengthn, such ascolorRampPallette(c("white", "dodgerblue4"))- main
a main title for the plot.
Details
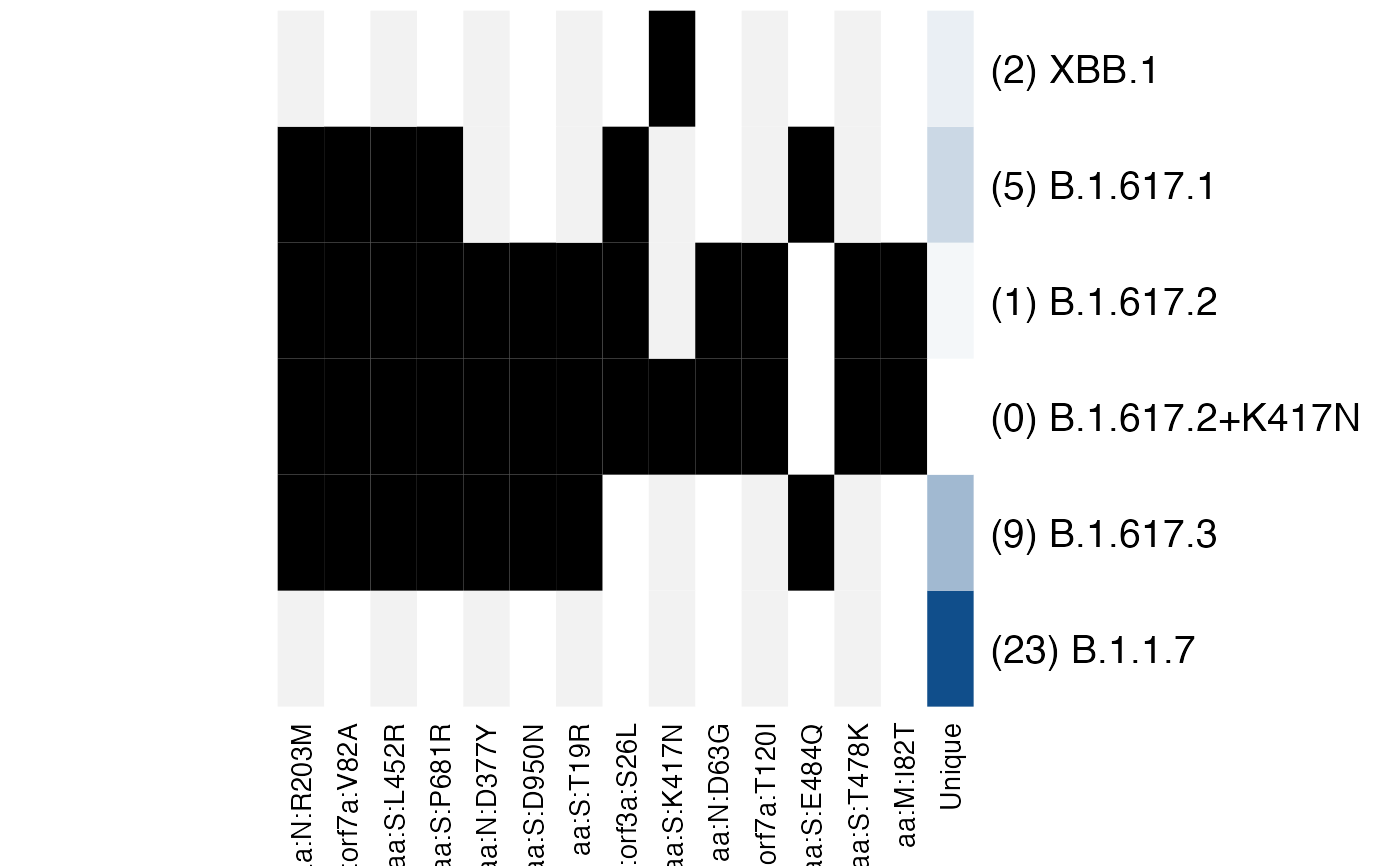
Every second column in the display has a slight grey background to make it easier to read which mutation is in which lineage.
The final column summarises the number of mutations that are unique to a given variant, with the darker colour representing a variant with more unique mutations. The number in the brackets gives the exact number of unique mutations.
Examples
# Choose lineages that I know have a lot of shared mutations
lineage_defs <- astronomize() |>
    filter_lineages(c("B.1.1.7", "B.1.617.1", "B.1.617.2",
        "B.1.617.2+K417N", "B.1.617.3", "XBB.1"))
# XBB.1 has 1 shared mutation and 2 unique mutations
# None of B.1.1.7's mutations are shared
plot_lineage_defs(lineage_defs)