Proportions of Variants of Concern (provoc) Analysis
provoc.RdApplies provoc_optim to analyze COVID-19 lineage proportions. It allows flexible lineage and mutation definitions.
Usage
provoc(
  formula,
  data,
  lineage_defs = NULL,
  by = NULL,
  bootstrap_samples = 0,
  update_interval = 20,
  verbose = FALSE,
  annihilate = FALSE
)
Arguments
- formula
A formula for the binomial model, like cbind(count, coverage) ~ .
- data
Data frame containing count, coverage, and lineage columns.
- lineage_defs
Optional lineage definitions; if NULL, uses astronomize().
- by
Column name to group and process data. If included, the results will contain a column labelled "group".
- bootstrap_samples
The number of bootstrap samples to use.
- update_interval
Interval for progress messages (0 to suppress).
- verbose
TRUE to print detailed messages.
- annihilate
TRUE to remove duplicate lineages from the data
Value
Returns an object of class 'provoc' with results from applying provoc_optim to the input data. The object has methods for print(), plot(), and summary(), but otherwise is treated as a dataframe. Fit information can be extracted as follows:
convergence(res)
get_lineage_defs(res): Mutation definitions used for analysis, provided
lineage_defsor defaultastronomize().
Outputs necessary information for subsequent analysis, including the use of the predict.provoc().
Examples
library(provoc)
# Load a dataset
data("Baaijens")
b1 <- Baaijens[Baaijens$sra == Baaijens$sra[1], ]
# Prepare the dataset
b1$mutation <- parse_mutations(b1$label)

# Analyze the dataset using the default mutation definitions
res <- provoc(formula = count / coverage ~ B.1.1.7 + B.1.617.2,
    data = b1, by = "sra")
res
#> Call: count/coverage ~ B.1.1.7 + B.1.617.2
#> <environment: 0x7fb9cdf15ac0>
#>
#> Mutations in lineage definitions:  325
#> Mutations used in analysis/mutations in data:
#> 74/772
#>
#> All models converged.
#>
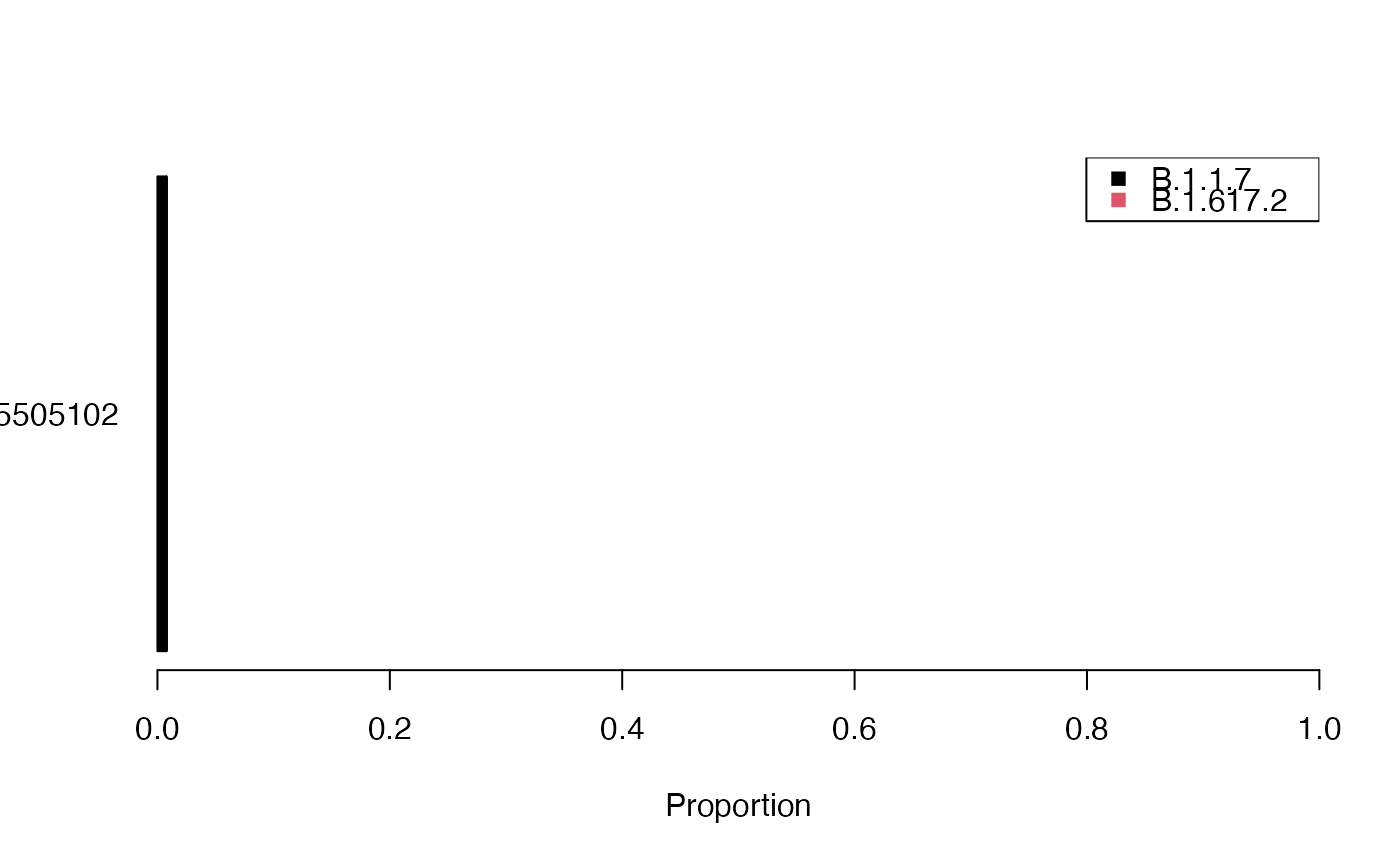
#> Top 2 lineages:
#>      rho ci_low ci_high   lineage         sra avg_spot_len sample_name
#> 1  0.008     NA      NA   B.1.1.7 SRR15505102          302         DU1
#> 2 <0.001     NA      NA B.1.617.2 SRR15505102          302         DU1
#>       bases  bioproject       date
#> 1 585534814 PRJNA741211 2021-01-19
#> 2 585534814 PRJNA741211 2021-01-19
as.data.frame(res) |> head()
#>            rho ci_low ci_high   lineage         sra avg_spot_len sample_name
#> 1 0.0075982608     NA      NA   B.1.1.7 SRR15505102          302         DU1
#> 2 0.0003679198     NA      NA B.1.617.2 SRR15505102          302         DU1
#>       bases  bioproject       date
#> 1 585534814 PRJNA741211 2021-01-19
#> 2 585534814 PRJNA741211 2021-01-19
summary(res)
#>
#> Call:
#> count/coverage ~ B.1.1.7 + B.1.617.2
#> <environment: 0x7fb9cdf15ac0>
#>
#> Deviance Residuals:
#>    Min. 1st Qu.  Median    Mean 3rd Qu.    Max.
#> -10.305  -2.000   0.000  -1.207   0.000   4.557
#>
#> Mutations in lineage definitions: 325
#> Mutations used in analysis/mutations in data:
#> 74/772
#>
#> Coefficients:
#>            rho ci_low ci_high   lineage         sra
#> 1 0.0075982608     NA      NA   B.1.1.7 SRR15505102
#> 2 0.0003679198     NA      NA B.1.617.2 SRR15505102
#>
#> Correlation of coefficients:
#> Error in bootstraps[[1]]: subscript out of bounds
plot(res)

predicted_values <- predict(res)